
Beginner’s Guide: How to get the best insights of your Search Console Performance report
Graphs, numbers, metrics and statistics – sounds overwhelming, doesn’t it? In this blog post we will guide you through the Google Search Console Performance report step by step so that you can get the best insights about your business’ online performance.
What is Google Search Console?
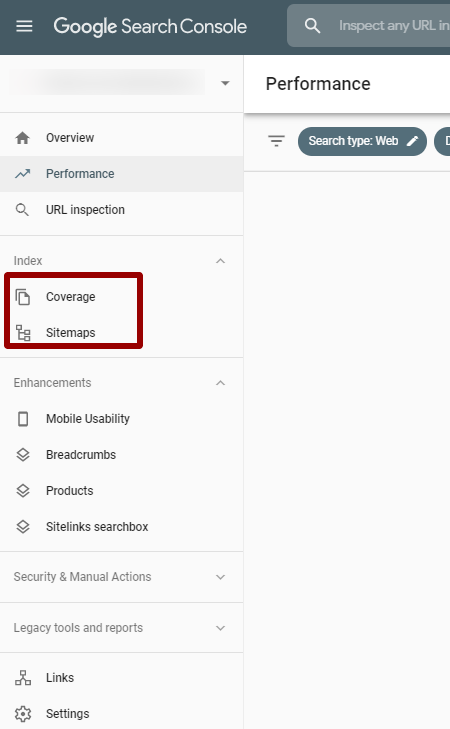
Google Search Console is a web service tool where you can get all your website data in one place. Here you will be able to check the mobile usability, performance, coverage, sitemaps and errors on your website. By using this tool Google will be able to understand which pages to crawl and check their status.
One of the most important aspects of having a Google Search Console account is submitting the sitemap. Sitemap is your “door†to Google. By submitting it to Google Search Console, Google will then be able to crawl your website and understand your links and pages. After your sitemap has been submitted and crawled, you will be able to see crawling errors in the Coverage report.
Once your website’s sitemap has been crawled and Google starts indexing your pages, Google will then start tracking your data in the Performance report. It may look daunting if you are looking at this report for the first time, but after you will finish reading this article, it might not look the same.
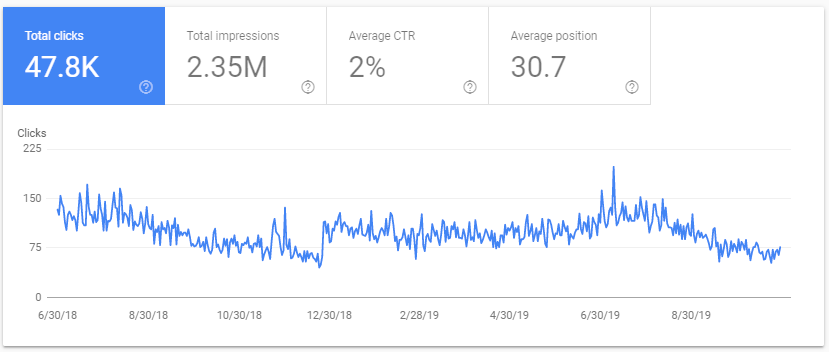
When you view the Search Console Performance report, you will see data from over the past 3 months by default. This however can be updated so that you can view data for the current day. By doing so you will have more up to date and accurate data for your report. Please bear in mind that Search Console data is a guide and does not present live, fully accurate results.
You can also view your website’s performance on Google Search Networks, such as Web (Google Search Results), Image (Google Image Search) and Video (Google Video Search). The Performance report will show all the data tracked for the date range you choose; within the Google Network you select. In the example below we have chosen to show the data within the last 16 months on the Web (Google Search Results).

What’s included in the Google Search Console Performance report?
Metric Analysis
Now let’s break it down a bit to see what each metric means:
-
Total Clicks
This represents the total number of clicks that resulted from coming up in a Google Search result. In a nutshell, for example a user searches for “high heeled shoes†and you come up in the results. If the user clicks on your website, Google would track that as 1 click. The Total Clicks metric only tracks the total number of clicks that have been recorded on your website. This metric does not include the times you came up in the search results with your paid Google Ads.
-
Total Impressions
This is the total number of times when a user sees your website link in the Google Search Results. This metric does not include the times you came up in the search results with your paid Google Ads.

-
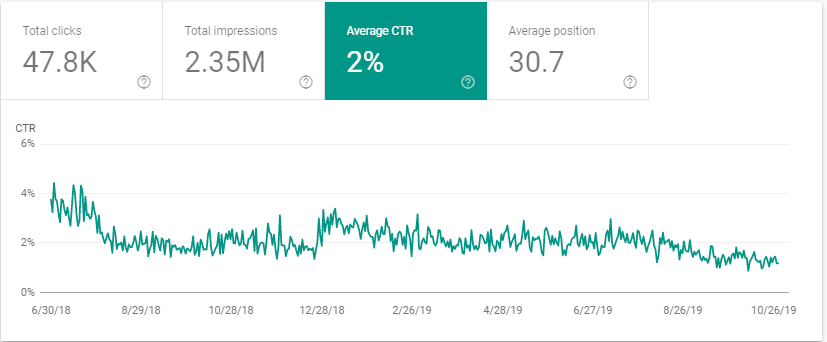
Average CTR
The Average Click-Through-Rate (Average CTR) is the percentage of impressions that resulted in a click. This is a good metric to keep an eye on as it will give you an insight on how appealing your website link is in the Google search results. This is directly related with the Meta policies. Having a unique, eye-catching meta title and description may help increase your click through rate. Adding phrases like: “Free deliveryâ€, “0% Interest Finance†might entice users to click through and see your products/services.
-
Average Position
The Average position is the average position of your website in Search results. This is based on the highest and lowest ranking position for the same page or search term for your website. For example, if your page ranks on the 1st position for one search term and 9th for another, the average position would be 5 ((1+9)/2=5).

Once you select the box, you will be able to see the average position column in the table below the graph for a break down at the query or landing page level. The main result as seen in the graph below, represents the total average position for your whole website.
Now we will have a look at how the data is broken down by queries, pages, countries, devices, search appearance and dates.
Performance table
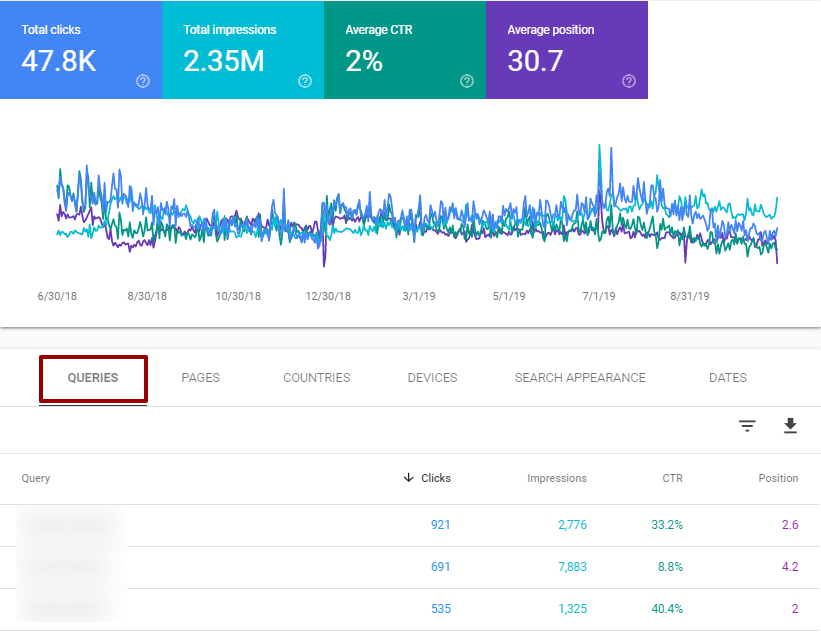
Under the graph in the Performance report you will find the performance table where the data is broken down by Queries, Pages, Countries, Devices, Search Appearance and Dates.
In the example below we have selected all 4 metrics above the graph, and you can see the columns in the table for every metric we have enabled. We have refined the data by queries and then by the number of clicks in descending order.
This report can be downloaded at any time to include all the columns and data you wish. Also, it can be filtered by any metric you would like to use for a better usage of the data.
-
Queries (Users’ Search Terms)
Search Terms Report
The data in this section is broken down by search terms that triggered your website to show in the Google search results.
You can sort the data by number of Clicks, Impressions, CTR or Position. The results can be a useful indication towards which search terms entered by the user are performing and which ones are not
performing as well. From this data you will also be able to find out which keywords are relevant and are not so relevant for your page.
Based on the number of clicks, impressions, CTR and position of the keyword you will be able to identify which pages need optimising.
If the average position for a search term is low, then doing a better optimisation might be the best approach for your page going forward. Bear in mind that this is one of the key search terms for your page.
For example, one of the search terms that comes up in the queries report is “black pointed high heels†and you have low impressions and a low ranking position. Then it’s worth checking to see if the search term is relevant to your page, and if so, take a look at how you can optimise your page to include that keyword.
-
Pages (Landing Pages)
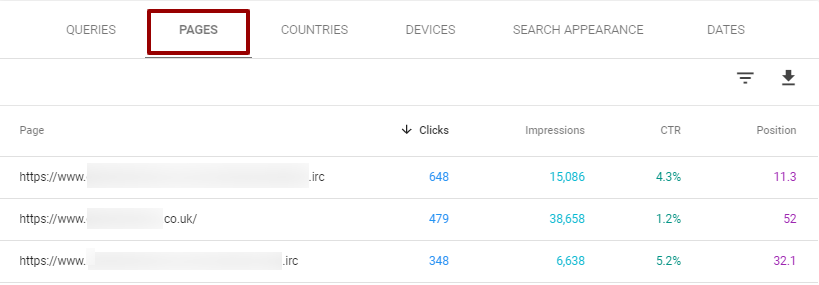
Landing Pages Report
The data under this tab shows the performance breakdown by landing pages.
Landing pages are the pages that came up in results for various search terms. Landing pages are very important to your website, as this is the first page a user will see on your website, once they have clicked on the search result.
You can then analyse which pages have the best average ranking position, the highest number of clicks/impressions and CTR. This is also a good way of checking if the pages are still available, and if the products are still in stock, etc.
-
Countries

The Countries tab in the performance report represents a breakdown of which country users are searching, viewing or clicking on your website in the results based on your browser location. This would allow you to have a better understanding on which countries would be best to target in other channels or paid ads.
-
 Devices
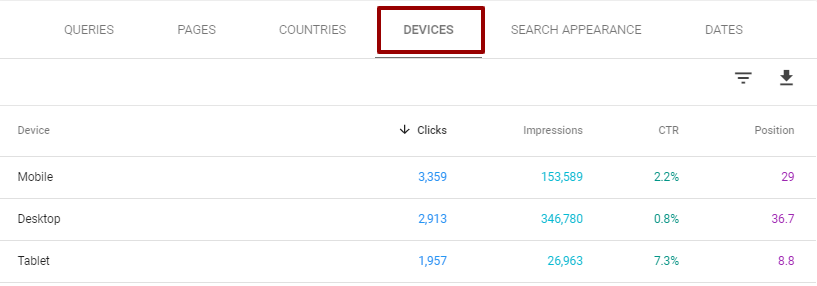
If you would like to find out which type of device your website performs well on, then this tab would give you the best insight.
The performance, especially the conversion rate might be affected if you don’t have a responsive or mobile friendly website. Google has now prioritised the Mobile devices by switching the desktop first indexing to the mobile first. This means that Google will first check the mobile version of your website for page speed. Mobile friendliness and other factors could affect the user experience on mobile devices.
Google stated that “more than 50 percent of search queries globally now come from mobile devices.“
-
Search Appearance
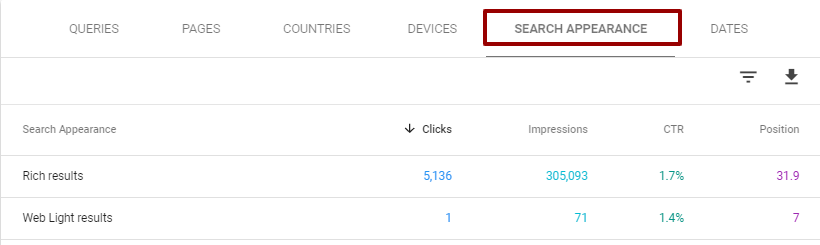
Search Appearance Report
The Search Appearance tab shows data about your website URLs that showed in more elaborated results formats on the search results page.
For example, Rich Results are the results defined in structure data such as AMP article rich results. Web Light results are a transcoded version of a page that has been optimised to show when the data connection is running slow.
-
Dates
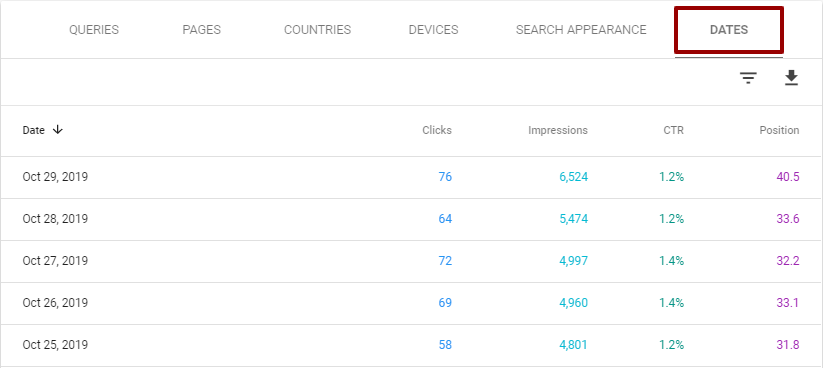
Dates Report
In the dates tab you will be able to see the performance based on specific days of the month and year, within the date range you have selected.
For example, if you would like to check how many clicks you had last Friday, then you can filter the results by date and check the results for a specific date.
Filter your way through
Now that you know what every metric means and how to break down your report based on your interest areas, it’s time to play with the filters!
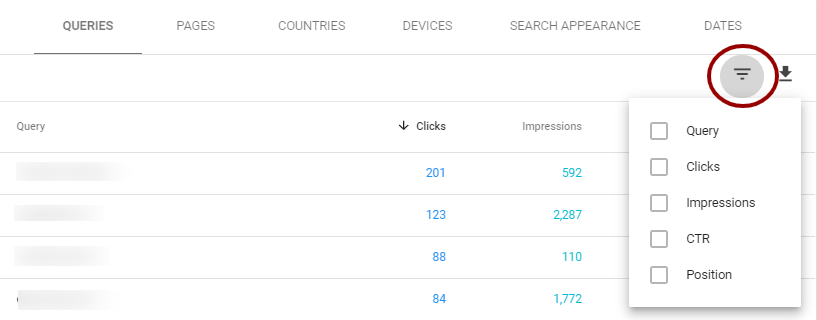
There is a filter button underneath the report tabs, near the download icon, that can help break down your data further.
You can filter your data by Query, for example search terms that include just “high heel†or pages that include “high-heels†in the URL.
Another option is to filter by Clicks, Impressions, CTR or Position.
Discrepancies
When comparing the data from the Search Console performance report with the data from Analytics, you may find notice a difference, which might raise some questions? Well, we have the answers to some of the possible questions that might crop up.
Not all is at it seems – Google Analytics does NOT show all data, due to user privacy settings. This is because of the cookies that track user’s behaviour and actions. When a user does not accept the cookie setting on a website, then Analytics would not track the user’s behaviour on the website. However Search Console will do.
This is one of the most common reasons why there is a significant discrepancy between the data from Analytics and Search Console, even though the two platforms are connected.
Not all search terms are the same – Queries are not the same in all the tools. Are you seeing different search terms in Google Ads, Analytics and Search Console? We see the difference too. Keywords/search terms/queries are seen differently between platforms.
For example, Google Ads would track the total number of searches for that keyword across the web, whereas Analytics would show just those keywords that have been returned your website in the search results.
Performance data has changed – Search Performance data can be preliminary sometimes. Google states on their support page that data might change slightly before it is confirmed, affecting mostly the data that is less than three days old.
Now that you have a better understanding of the Search Console Performance Report, you can start optimising your website based on the report ‘s insights!